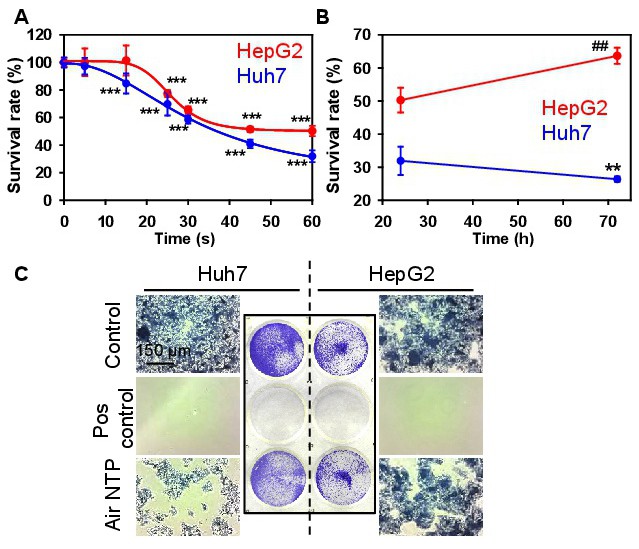
Fig. 1. NTP treatment demonstrates anti-proliferative activity against hepatic tumour cells. (A) Cell viability of Huh7 and HepG2 was analysed by WST-1 assay 24 h post plasma treatment. The data were normalized to control values (no exposure), which were set as 100 % cell viability. Readings were done in quadruplicates, data are present as mean ± SEM, n=3 (three independent experiments). One-way ANOVA with Newman-Keuls multiple comparison test was used; t=0 time point serving as control; *P< 0.05, ***P< 0.001. (B) Comparison of survival rate between Huh7 and HepG2 cell lines 24 and 72 h post plasma treatment. Data are assessed as in (A); ##P< 0.01, **P< 0.01, comparison 72 vs 24 h post plasma treatment. (C) The reduced colonogenicity of NTP-treated Huh7 cells. In this experiment the effect of NTP on Huh7 and HepG2 was examined by colony formation assay. Positive control - 20 % ethanol for 60 min.